


In November 2024, Anthropic announced the Model Context Protocol (MCP). Since then, several open-source MCP projects have emerged that leverage LLMs to manage various workflows with greater convenience and intelligence, including Slack automation, todo list management, web search, database queries, and many more.
LLMs become significantly more capable when provided with relevant context. MCP offers a standardized framework for injecting this additional context, enabling models to perform more specialized and informed tasks without requiring fine-tuning.
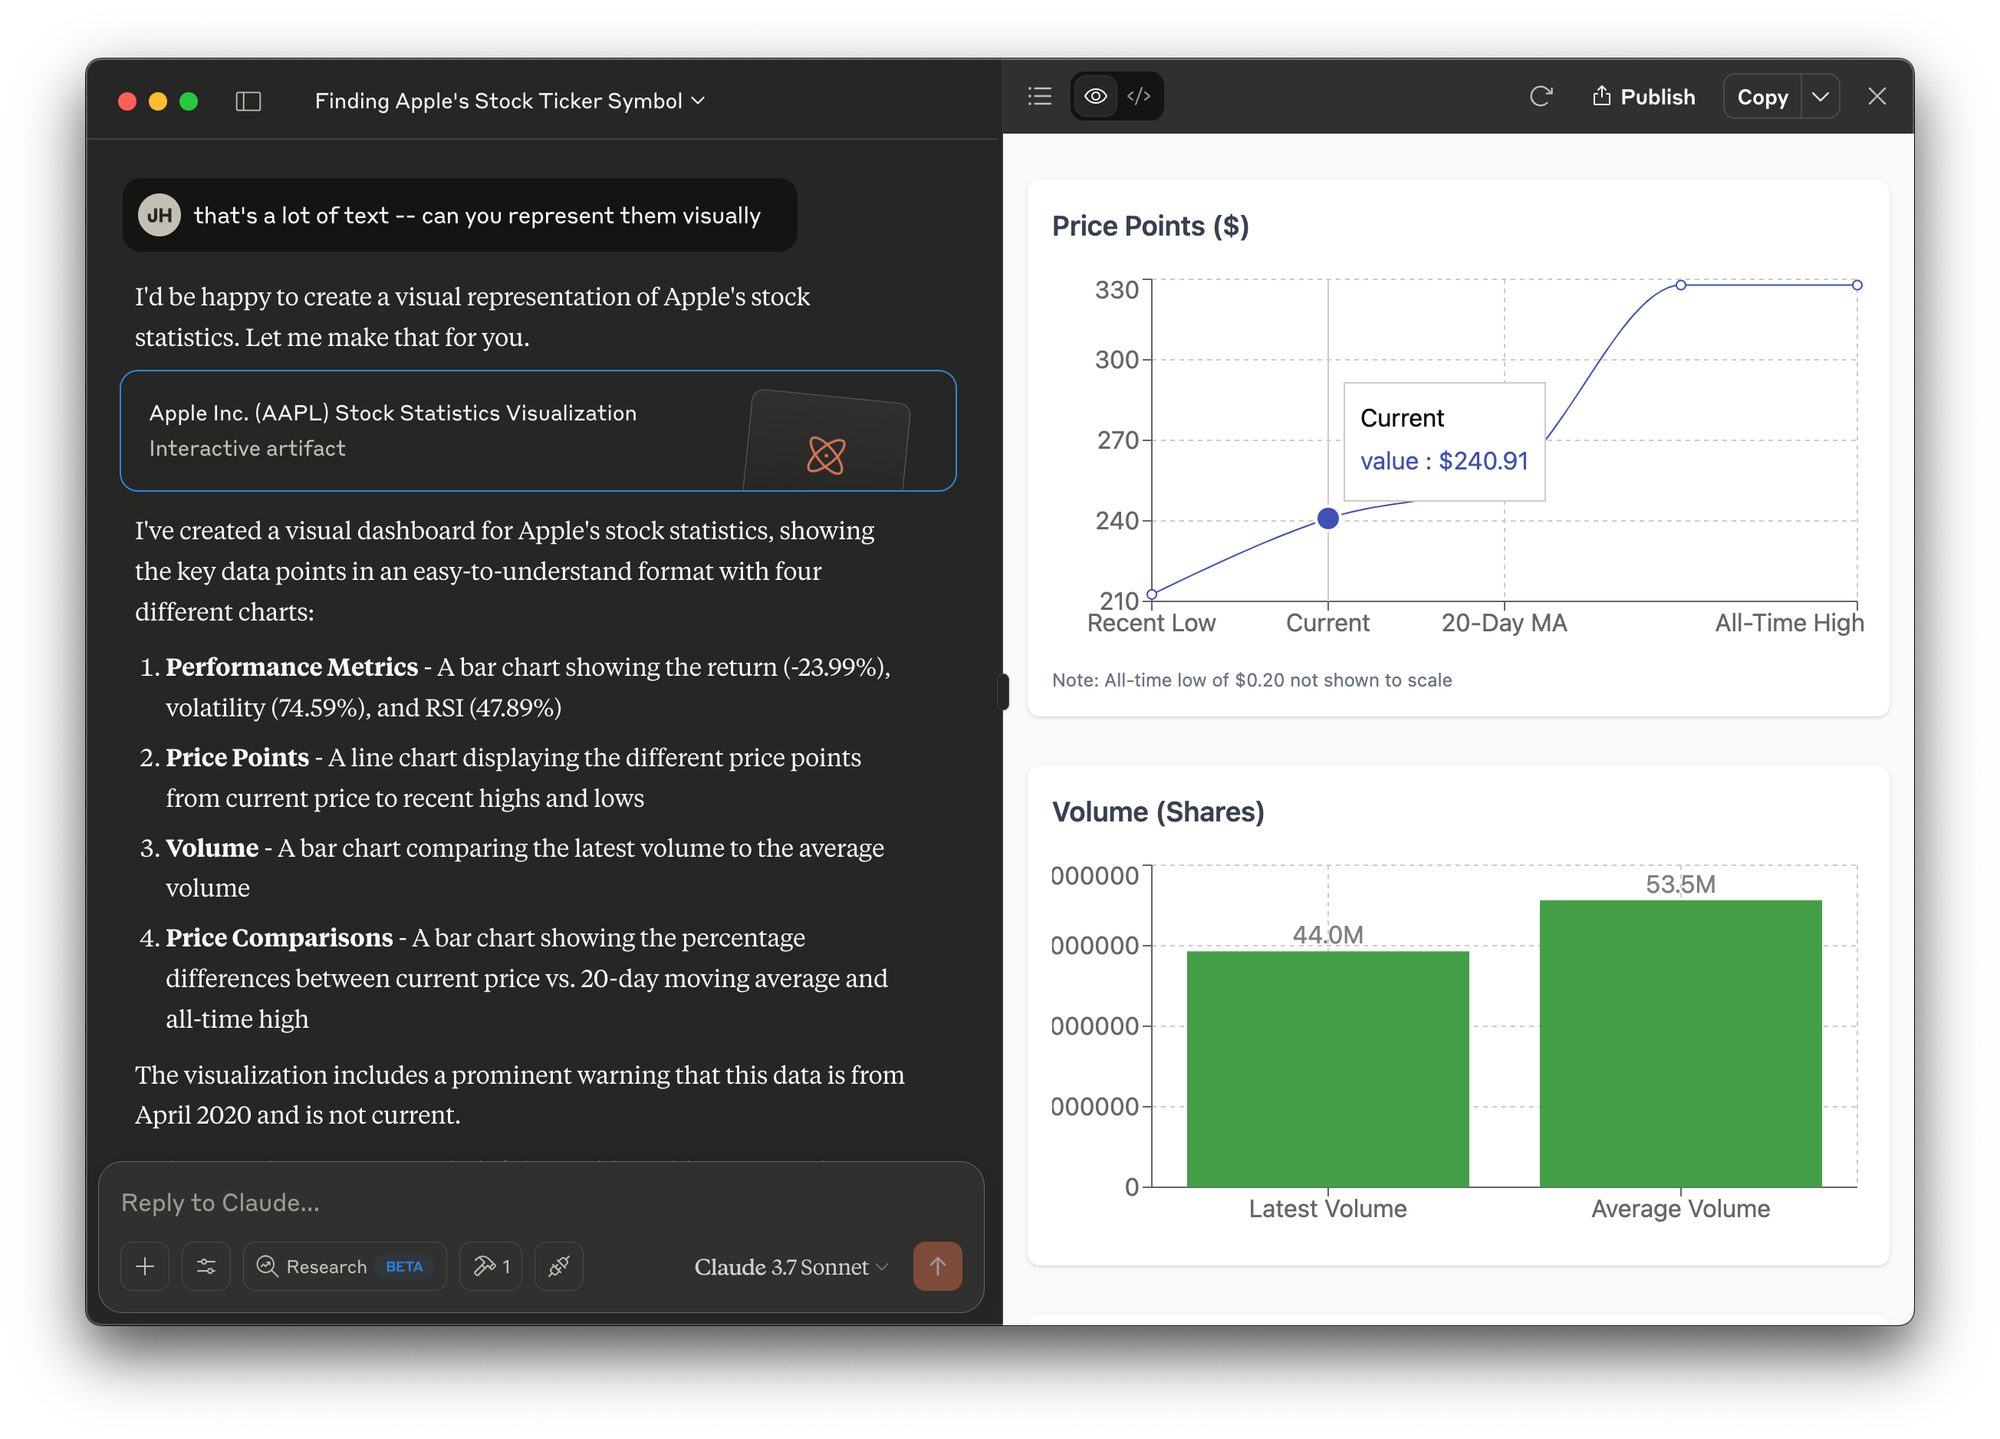
There are many applications for MCP. So let's just dive into it with a simple example. In today's one day tour, we will create an MCP server that provides statistical analysis on stock data. Combining with the capability of LLM, we can end up with results like below:
Prerequisites
We will use the MCP python SDK, so install it with: uv pip install "mcp[cli]"
For guidance on uv, you can check out our uv one day tour.
We will also need an LLM client that interacts with our MCP server. The easiest is to use Claude desktop, which you can download from here. It does mean you should also have a Claude account. If you don't already use Claude, no worries, there are many MCP clients you can choose from.
Getting Data
We will use the Stock Market Dataset. This is a static dataset that you can download. Once you become familiar with MCP and how to feed data, you can use your favorite stock data API for up-to-date data feed.
Download this dataset. What you will see is that there's a symbols_valid_meta.csv file that maps company name to their stock symbol, and in the stocks and etfs subfolder, there are more than 8,000 csv files, each corresponds to an individual stock.
If we were to analyze several stocks, we'd need to load up several csv files and examine them manually. This would be a very tedious process. So we will connect this dataset with LLM using a simple MCP server.
The MCP Server
We will jump right into the code. The full code we are using today is below. Copy it into a server.py file.
# server.py
import json
import pandas as pd
from mcp.server.fastmcp import FastMCP, Context

FILE_PATH = "{YOUR_FILE_PATH_TO_DOWNLOADED_DATA}/data/"
mcp = FastMCP("StockExplorer", dependencies=["pandas"])


def get_likely_symbols(company_name: str) -> dict[str, str]:
    """Get all stock symbols that contain the company name."""
    all_symbols = pd.read_csv(FILE_PATH + "symbols_valid_meta.csv")
    matches = all_symbols[all_symbols["Security Name"].str.lower().str.contains(company_name.lower())]
    return matches.to_dict(orient='records')


@mcp.prompt()
async def find_ticker(company_name: str) -> str:
    likely_symbols = get_likely_symbols(company_name)
    return f"""
I need to find the ticker symbol for {company_name}.

First, please look at the likely list of stocks, provided below.
Then, search through that data to find the best matching company name and return the ticker symbol.
If there are multiple potential matches, please list the most likely one.

Here are the likely stock symbols:
{json.dumps(likely_symbols, indent=2)}
"""


@mcp.resource("stats://{symbol}")
def resource_stock_stats(symbol: str) -> str:
    """Get stock stats for a given symbol."""
    all_symbols = pd.read_csv(FILE_PATH + "symbols_valid_meta.csv")

    matching_symbols = all_symbols[all_symbols["Symbol"] == symbol]
    if matching_symbols.empty:
        raise ValueError(f"Symbol '{symbol}' not found in our database")

    symbol_data = matching_symbols.iloc[0]
    is_etf = symbol_data["ETF"] == "Y"
    if is_etf:
        folder = "etfs/"
    else:
        folder = "stocks/"

    full_path = FILE_PATH + folder + symbol + ".csv"
    df = pd.read_csv(full_path)
    oldest_date = df['Date'].min()
    newest_date = df['Date'].max()

    # Take the most recent 50 rows for analysis
    recent_df = df.tail(50).copy()

    # Calculate daily returns
    recent_df['Daily Return'] = recent_df['Adj Close'].pct_change()

    # Calculate key metrics on recent data
    recent_return = ((recent_df['Adj Close'].iloc[-1] / recent_df['Adj Close'].iloc[0]) - 1) * 100
    recent_volatility = recent_df['Daily Return'].std() * (252 ** 0.5) * 100  # Annualized

    # Calculate moving averages
    recent_df['MA20'] = recent_df['Adj Close'].rolling(window=20).mean()

    # Calculate RSI (14-day)
    delta = recent_df['Adj Close'].diff()
    gain = (delta.where(delta > 0, 0)).rolling(window=14).mean()
    loss = (-delta.where(delta < 0, 0)).rolling(window=14).mean()
    # Avoid division by zero
    loss_nonzero = loss.replace(0, 0.001)
    rs = gain / loss_nonzero
    recent_df['RSI'] = 100 - (100 / (1 + rs))

    # Get high and low
    recent_high = float(recent_df['High'].max())
    recent_high_date = recent_df.loc[recent_df['High'].idxmax(), 'Date']
    recent_low = float(recent_df['Low'].min())
    recent_low_date = recent_df.loc[recent_df['Low'].idxmin(), 'Date']

    # All-time high and low
    all_time_high = float(df['High'].max())
    all_time_high_date = df.loc[df['High'].idxmax(), 'Date']
    all_time_low = float(df['Low'].min())
    all_time_low_date = df.loc[df['Low'].idxmin(), 'Date']

    # Recent average volume
    recent_avg_volume = int(recent_df['Volume'].mean())

    # Current price
    current_price = float(recent_df['Close'].iloc[-1])

    stats = {
        "data_summary": {
            "full_date_range": f"{oldest_date} to {newest_date}",
            "analysis_period": "Last 50 trading days"
        },
        "recent_performance": {
            "return_pct": round(recent_return, 2),
            "annualized_volatility_pct": round(recent_volatility, 2),
            "current_rsi": round(float(recent_df['RSI'].iloc[-1]), 2),
            "highest_price": {"price": round(recent_high, 2), "date": recent_high_date},
            "lowest_price": {"price": round(recent_low, 2), "date": recent_low_date}
        },
        "technical_indicators": {
            "current_price": round(current_price, 2),
            "20_day_ma": round(float(recent_df['MA20'].iloc[-1]), 2) if not pd.isna(recent_df['MA20'].iloc[-1]) else None,
            "price_vs_ma20": f"{round((current_price / float(recent_df['MA20'].iloc[-1]) - 1) * 100, 2)}%" if not pd.isna(recent_df['MA20'].iloc[-1]) else None
        },
        "historical_context": {
            "all_time_high": {"price": round(all_time_high, 2), "date": all_time_high_date},
            "all_time_low": {"price": round(all_time_low, 2), "date": all_time_low_date},
            "current_vs_ath": f"{round((current_price / all_time_high - 1) * 100, 2)}%"
        },
        "volume": {
            "recent_avg_volume": recent_avg_volume,
            "latest_volume": int(recent_df['Volume'].iloc[-1]),
            "volume_trend": "Above average" if recent_df['Volume'].iloc[-1] > recent_avg_volume else "Below average"
        }
    }
    return json.dumps(stats, indent=2)


@mcp.tool()
async def get_stock_stats(symbol: str, ctx: Context) -> str:
    """Get stats on a stock."""
    res = await ctx.read_resource(f"stats://{symbol}")
    return res
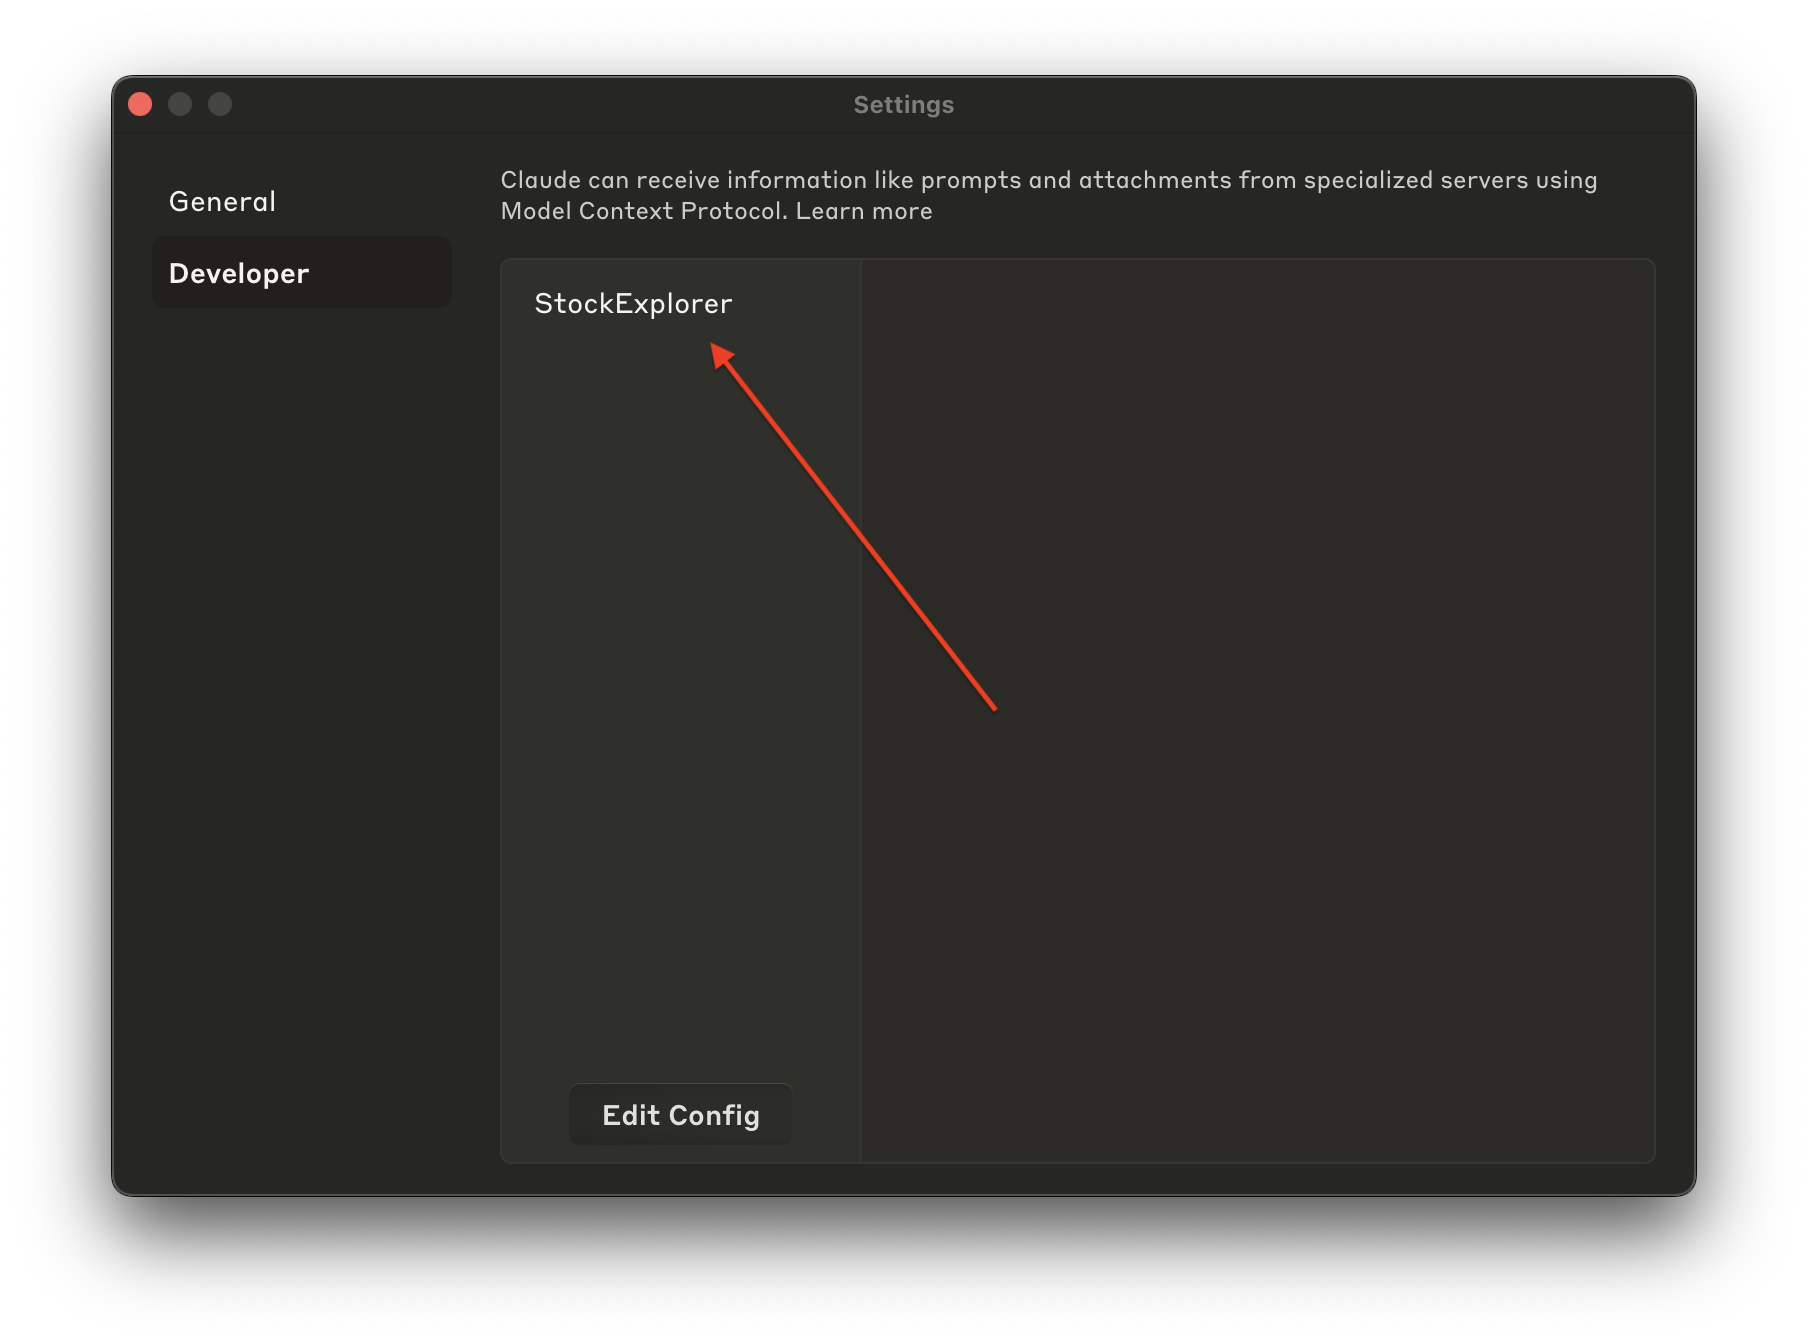
Once you have set up this server.py, you can run it with mcp install server.py
Then, you should see the StockExplorer server being recognized as an MCP server within Claude Desktop by going Claude → Settings → Developer
Prompt
Now let's leverage the @mcp.prompt() we have defined:
# server.py

# ...

def get_likely_symbols(company_name: str) -> dict[str, str]:
    """Get all stock symbols that contain the company name."""
    all_symbols = pd.read_csv(FILE_PATH + "symbols_valid_meta.csv")
    matches = all_symbols[all_symbols["Security Name"].str.lower().str.contains(company_name.lower())]
    return matches.to_dict(orient='records')


@mcp.prompt()
async def find_ticker(company_name: str) -> str:
    likely_symbols = get_likely_symbols(company_name)
    return f"""
I need to find the ticker symbol for {company_name}.

First, please look at the likely list of stocks, provided below.
Then, search through that data to find the best matching company name and return the ticker symbol.
If there are multiple potential matches, please list the most likely one.

Here are the likely stock symbols:
{json.dumps(likely_symbols, indent=2)}
"""

# ...
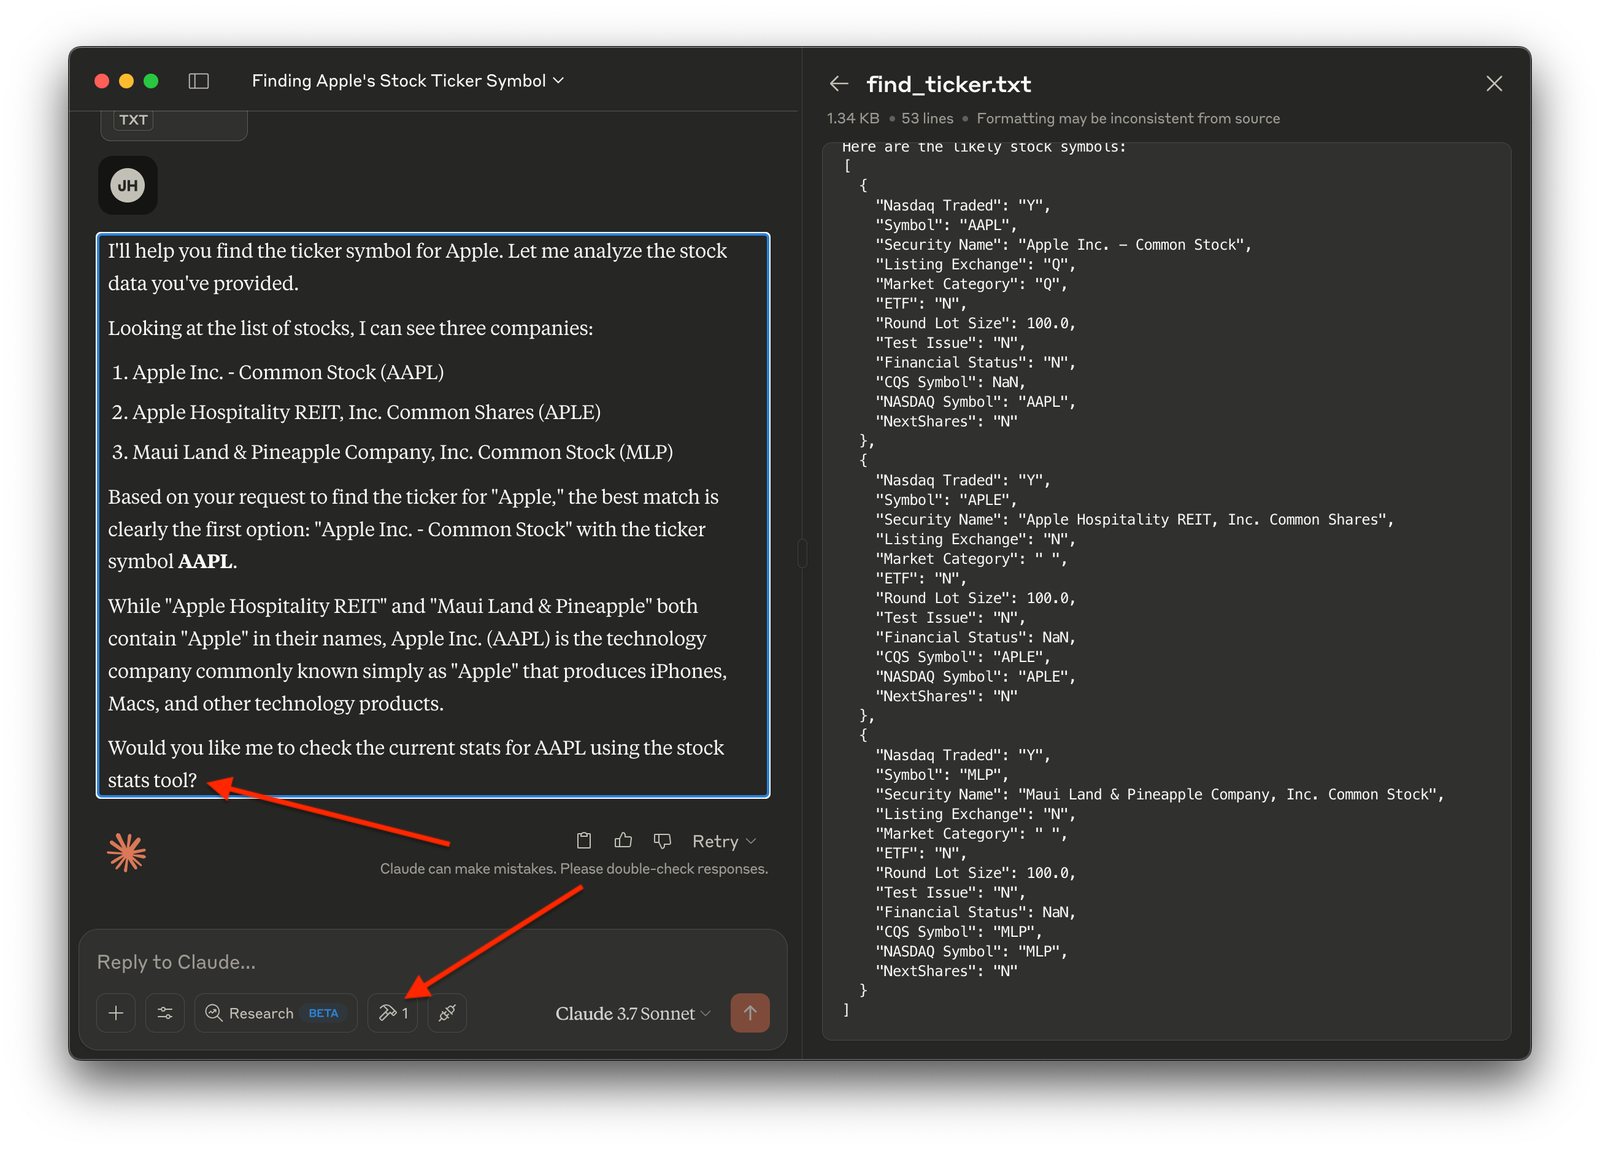
We are effectively defining a prompt template that can be used, say, with Claude Desktop. For example, I can look up the ticker symbol for Apple by doing the following:

As you see, we can load up the local data, and search for companies with the word "apple". There are a few choices, and the LLM determines for us which one is the most likely candidate. At the end of this prompt, we get the correct stock symbol "AAPL". In addition, since we have also defined a tool that can analyze stock statistics, Claude is also asking us if it should "check the current stats for AAPL using the stock stats tool". So let's take a look deeper into how the MCP tool is defined.
Resource and Tool
Returning to the server.py code, there is a get_stock_stats() MCP tool defined:
# server.py

# ...

@mcp.tool()
async def get_stock_stats(symbol: str, ctx: Context) -> str:
    """Get stats on a stock."""
    res = await ctx.read_resource(f"stats://{symbol}")
    return res

# ...
The function is very simple – it's just calling ctx.read_resource(f"stats://{symbol}"). So what does it do?
MCP Resource is exactly how data is exposed to the LLM client. We define resource "protocol" as a python operation, assigning it with a resource identifier "stats". Within this operation, we can load up the data, and perform any statistical analysis we'd like. We can also retrieve live data via API calls, instead of static, downloaded dataset.
# server.py

# ...


@mcp.resource("stats://{symbol}")
def resource_stock_stats(symbol: str) -> str:
    """Get stock stats for a given symbol."""
    all_symbols = pd.read_csv(FILE_PATH + "symbols_valid_meta.csv")

    matching_symbols = all_symbols[all_symbols["Symbol"] == symbol]
    if matching_symbols.empty:
        raise ValueError(f"Symbol '{symbol}' not found in our database")

    symbol_data = matching_symbols.iloc[0]
    is_etf = symbol_data["ETF"] == "Y"
    if is_etf:
        folder = "etfs/"
    else:
        folder = "stocks/"

    full_path = FILE_PATH + folder + symbol + ".csv"
    df = pd.read_csv(full_path)
    oldest_date = df['Date'].min()
    newest_date = df['Date'].max()

    # Take the most recent 50 rows for analysis
    recent_df = df.tail(50).copy()

    # Calculate daily returns
    recent_df['Daily Return'] = recent_df['Adj Close'].pct_change()

    # ... Add any stats operations you'd like ...

    stats = {
        "data_summary": {
            "full_date_range": f"{oldest_date} to {newest_date}",
            "analysis_period": "Last 50 trading days"
        },
        # ... Add any stats results you'd like ...
    }
    return json.dumps(stats, indent=2)

# ...
@mcp.resource function should be string, as far as I can tell. Didn't work when I returned a full Pandas dataframe. While MCP Resource obtains data, it is the MCP Tool that interfaces with the LLM client, and acts just like a typical tools call (or function calling). When the get_stock_stats() tool is available, we can easily look up the stats of the AAPL stock.
Data-Enhanced LLM
Now that Claude is injected with real data, we can perform ad hoc analysis very easily. For example, we can ask for some visual illustration of the statistics.
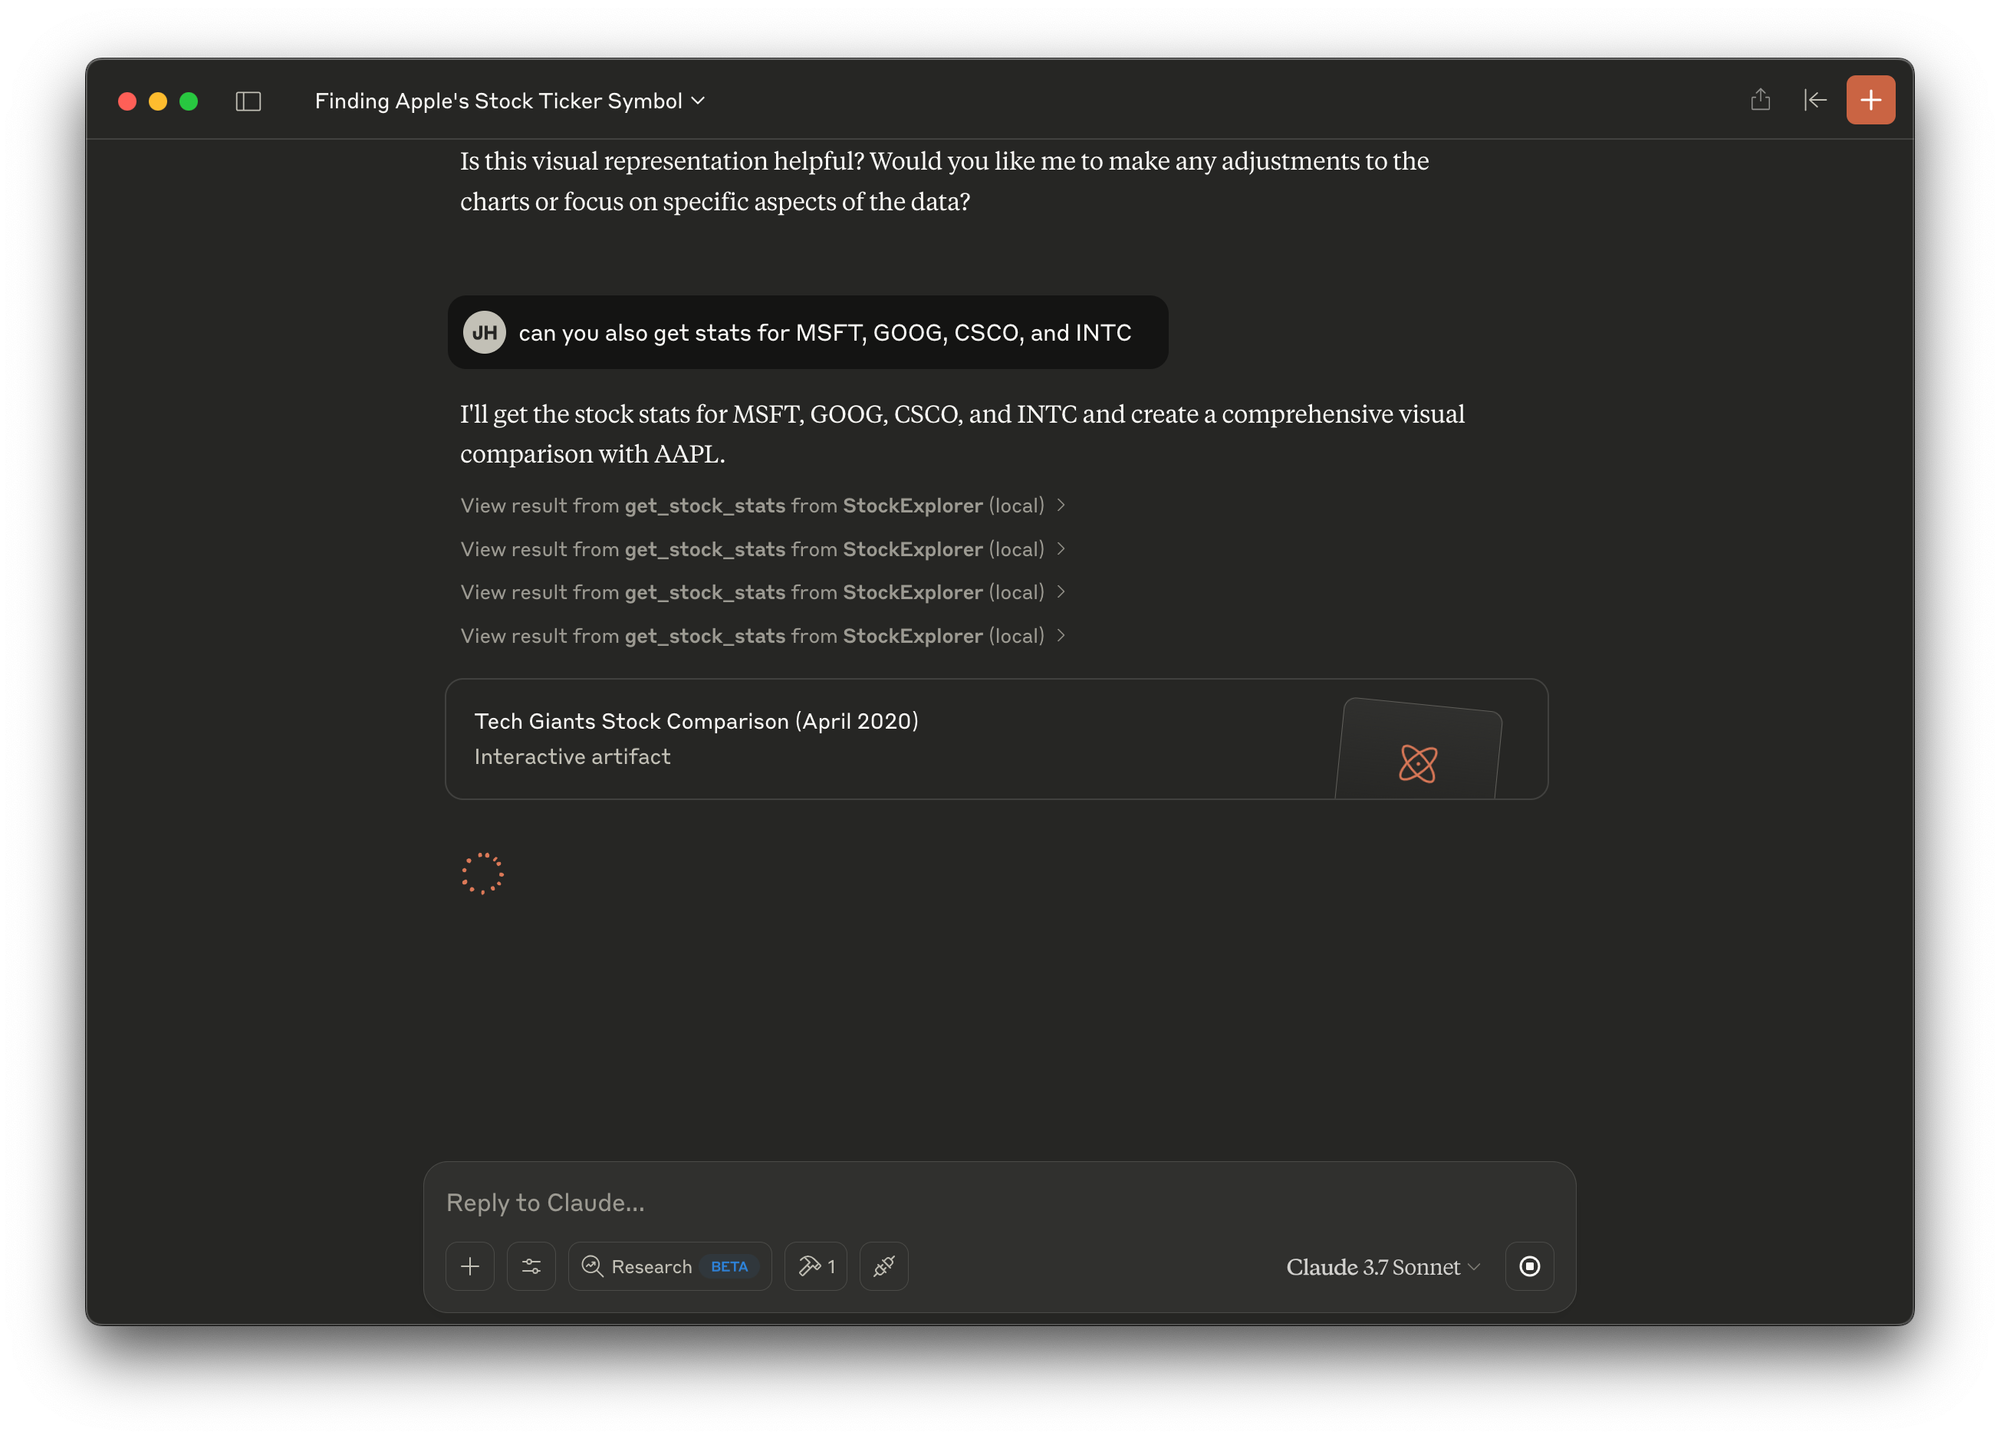
In a typical data analysis workflow that involves multiple datasets, we have to load each of them into Pandas, and run our analysis one at a time. We can define functions to handle large-scale analysis, but these functions need to be clearly defined for a specific purpose.
With MCP, we can make the data source available to LLM. And then we can have a natural language interface to easily interrogate our datasets. In addition, we can have LLM take some quick passes at simple data visualization – so we can check if there are meaningful patterns to investigate further. This makes exploratory data analysis a lot more efficient and, honestly, quite fun!
I found MCP to be a really cool way to turbo charge LLM, so it can help me get more work done. As we move towards a reality where LLMs exist in all human-computer interfaces, a consistent framework for introducing external data into LLMs will be as prevalent as APIs are in today's software ecosystem. So give it a try and see what you can build with MCP!


